If you’re following the news today, you may feel a bit unsure about what’s happening with
[home prices](https://www.simplifyingthemarket.com/2023/04/17/think-twice-before-waiting-for-lower-home-prices/?a=713258-9a8342bcf821027012880bf1d7cccbf7)
and fear whether or not the worst is yet to come. That’s because today’s headlines are painting an
[unnecessarily negative](https://www.simplifyingthemarket.com/2023/05/09/why-todays-housing-market-is-not-about-to-crash/?a=713258-9a8342bcf821027012880bf1d7cccbf7)
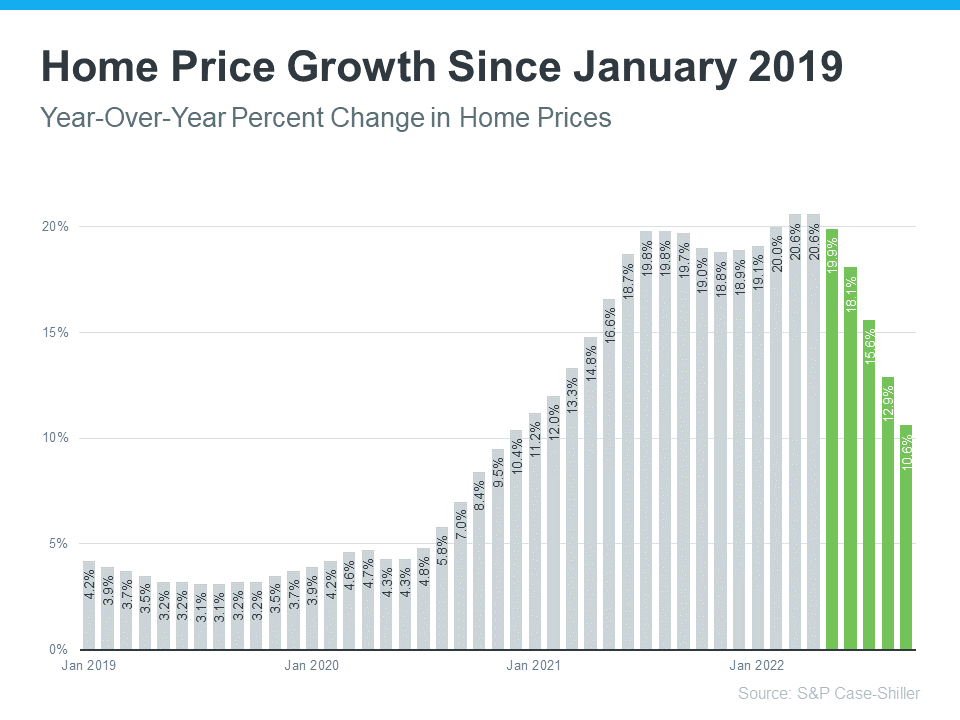
picture. If we take a year-over-year view, home prices did
[drop](https://spglobal.com/spdji/en/index-announcements/article/sp-corelogic-case-shiller-index-continued-gains-in-april/)
some, but that’s because we’re comparing to a
[‘unicorn’ year](https://www.simplifyingthemarket.com/2023/05/30/todays-real-estate-market-the-unicorns-have-galloped-off/?a=713258-9a8342bcf821027012880bf1d7cccbf7)
when prices peaked well beyond the norm. To avoid an unfair comparison to that previous peak, we need to look at monthly data. And that tells a very different and much more positive story. While local home price trends still vary by market, here’s what the national data tells us. The
[graphs](https://www.spglobal.com/spdji/en/indices/indicators/sp-corelogic-case-shiller-us-national-home-price-nsa-index/#news-research)
below use
recent monthly
[reports](https://www.fhfa.gov/DataTools/Downloads/Pages/House-Price-Index.aspx)
from three
[sources](https://www.corelogic.com/category/intelligence/reports/home-price-insights/)
to show the worst home price declines are already behind us, and prices are appreciating nationally. [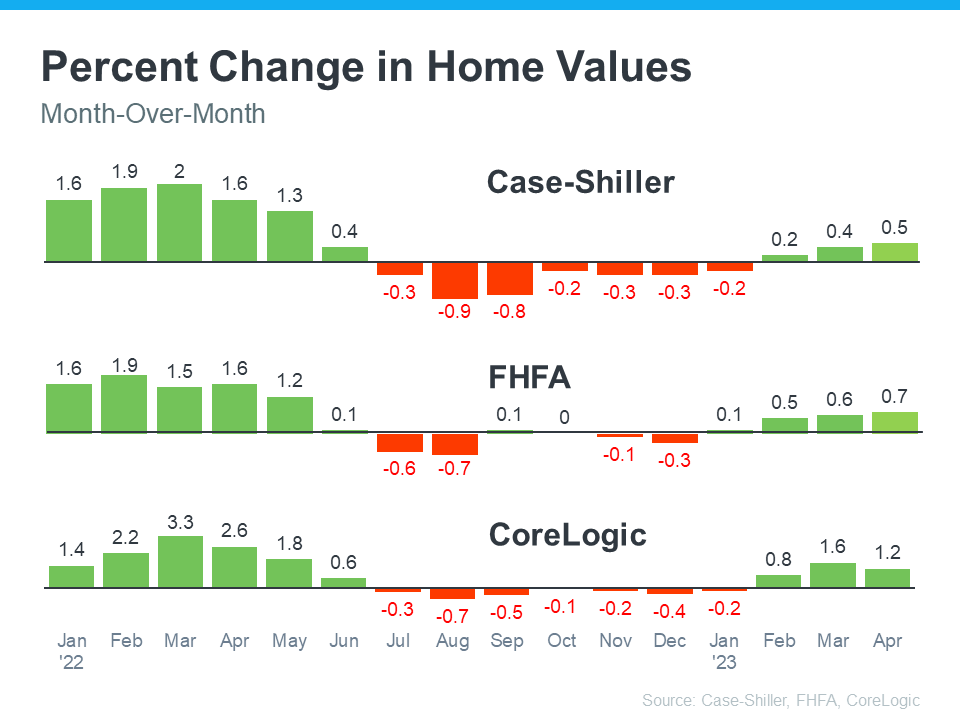](https://www.simplifyingthemarket.com/content/images/20230712/20230717-Percent-change-in-home-values.png?a=713258-9a8342bcf821027012880bf1d7cccbf7) Looking at this monthly view, we can see the past year in the housing market can be divided into two parts. In the first half of 2022, home prices were going up, and fast. However, starting in July, prices began to go down (_shown in red in the graphs above_). By around August or September, the trend started to stabilize. But, looking at the most recent data for early 2023, these graphs also show that prices are going up again. The fact that all three reports show prices have been going up for three or more straight months is an encouraging sign for the housing market. The month-over-month data indicates a national shift is happening –
home prices are rising again. Craig J. Lazzara, Managing Director at
_S&P Dow Jones Indices_,
[says](https://www.spglobal.com/spdji/en/documents/indexnews/announcements/20230627-1464869/1464869_cshomeprice-release-0627.pdf)
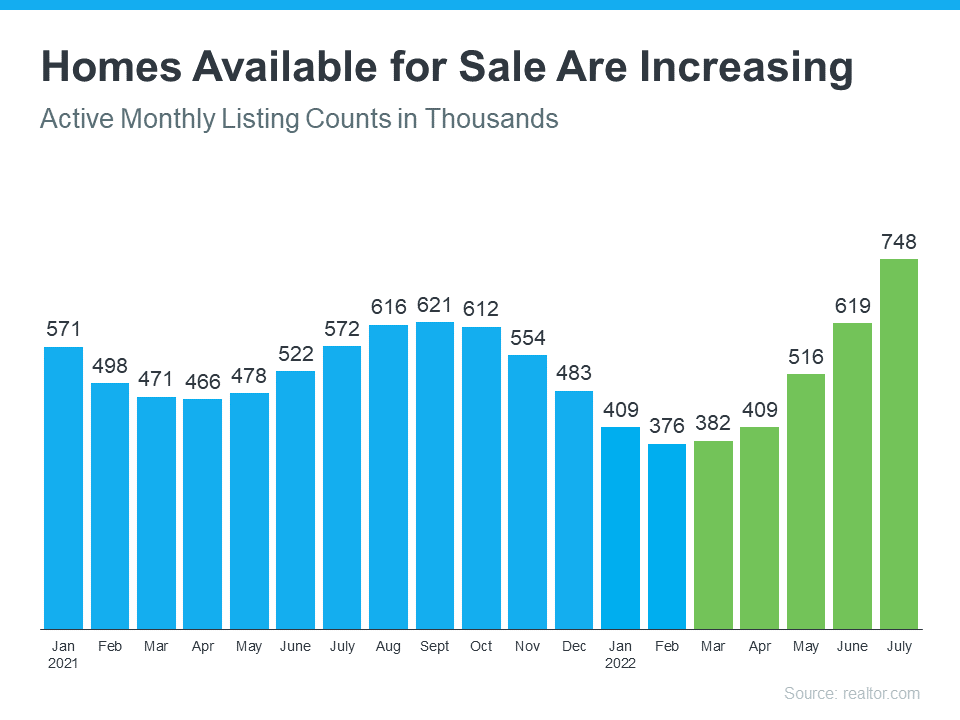
this about home price trends: ###### _“If I were trying to make a case that the decline in home prices that began in June 2022 had definitively ended in January 2023, April’s data would bolster my argument.”_ Experts believe one of the reasons prices didn’t crash like some expected is because there aren’t enough available
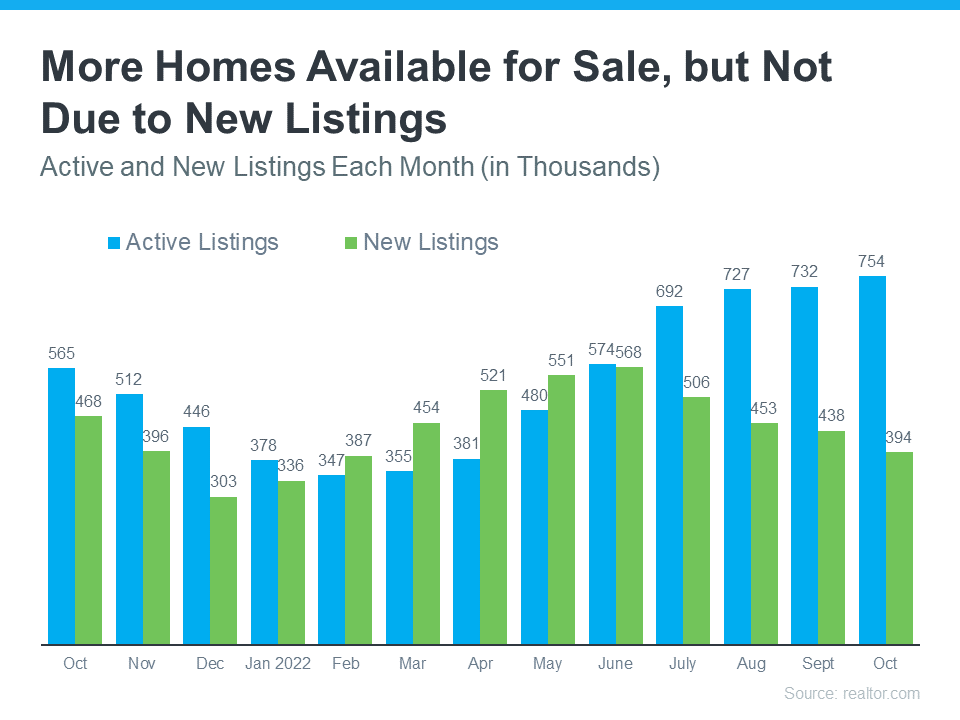
[homes](https://www.simplifyingthemarket.com/2023/07/06/todays-housing-inventory-is-a-sweet-spot-for-sellers/?a=713258-9a8342bcf821027012880bf1d7cccbf7)
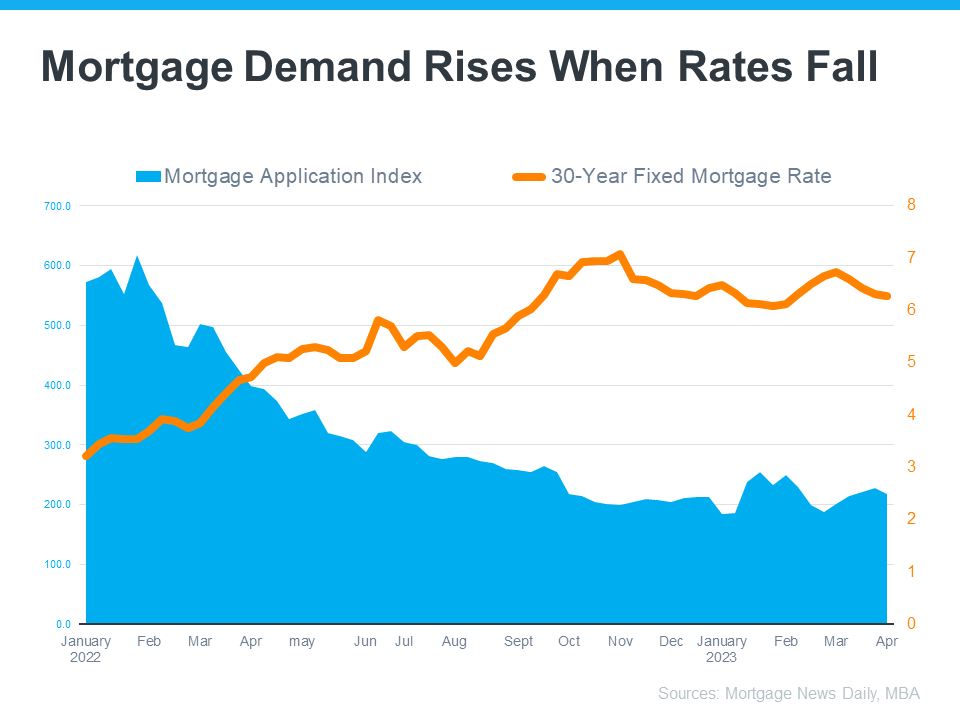
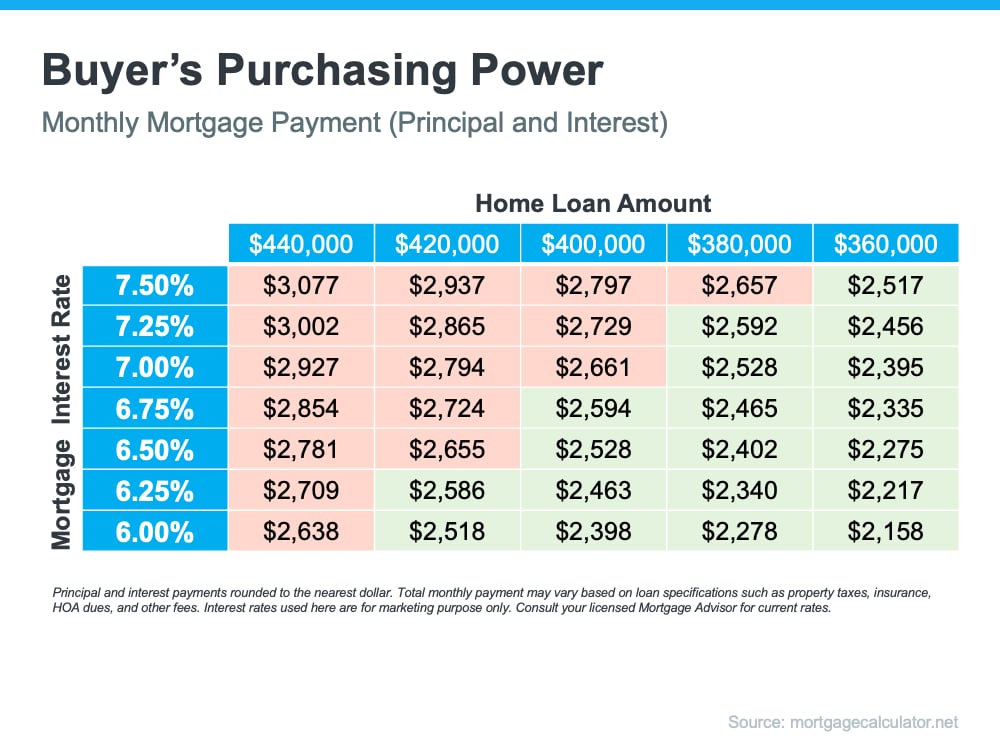
for the number of people who want to buy them. Even with today’s
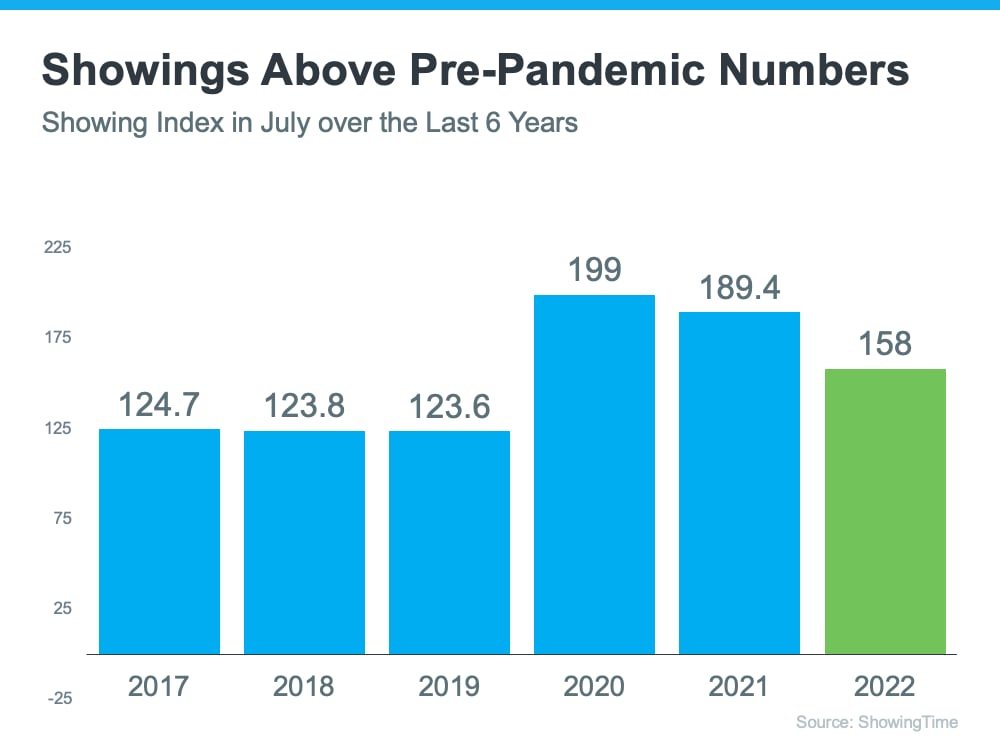
[mortgage rates](https://www.simplifyingthemarket.com/2023/06/13/your-needs-matter-more-than-todays-mortgage-rates/?a=713258-9a8342bcf821027012880bf1d7cccbf7), there are more people looking to buy than there are homes available for sale. Mark Fleming, Chief Economist at
_First American_,
[explains](https://blog.firstam.com/economics/why-higher-mortgage-rates-dont-always-lead-to-declining-house-prices)
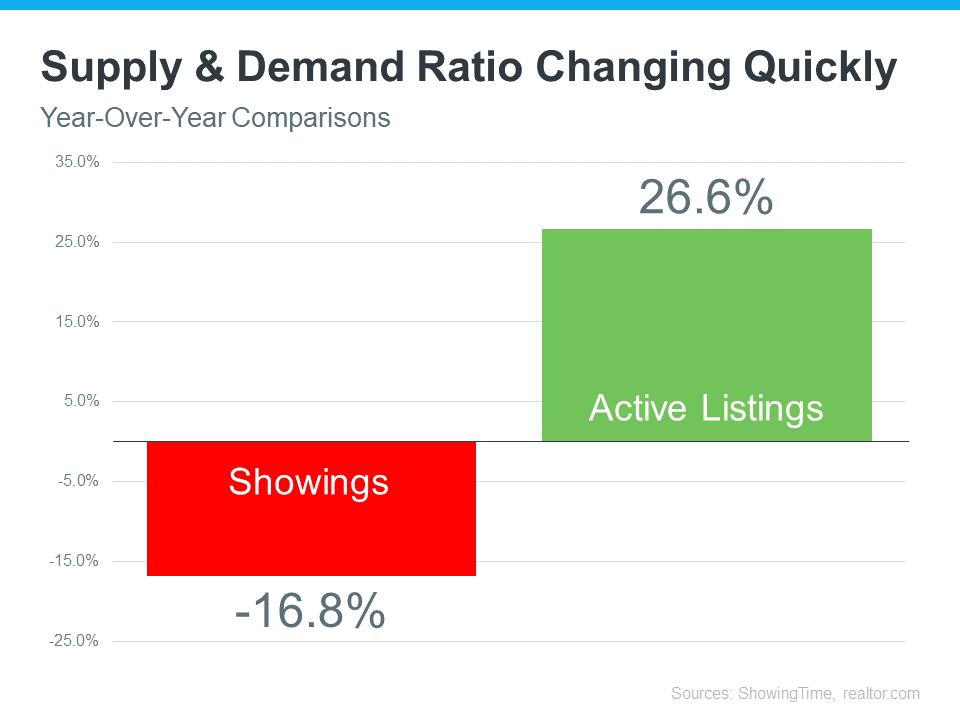
how more demand than supply keeps upward pressure on prices: ###### _“History has shown that higher rates may take the steam out of rising prices, but it doesn’t cause them to collapse entirely. This is especially true in today’s housing market, where the_
demand for homes continues to outpace supply, keeping the pressure on house prices__.

Home Prices Are Rebounding
Discover why experts believe the worst is over and prices are rising again.